03 · Product & UX/UI
One Community Global · Nonprofit
Governance
Dashboard
One open-source home for proposals and decisions. It replaces scattered sheets, emails and docs for volunteers worldwide.
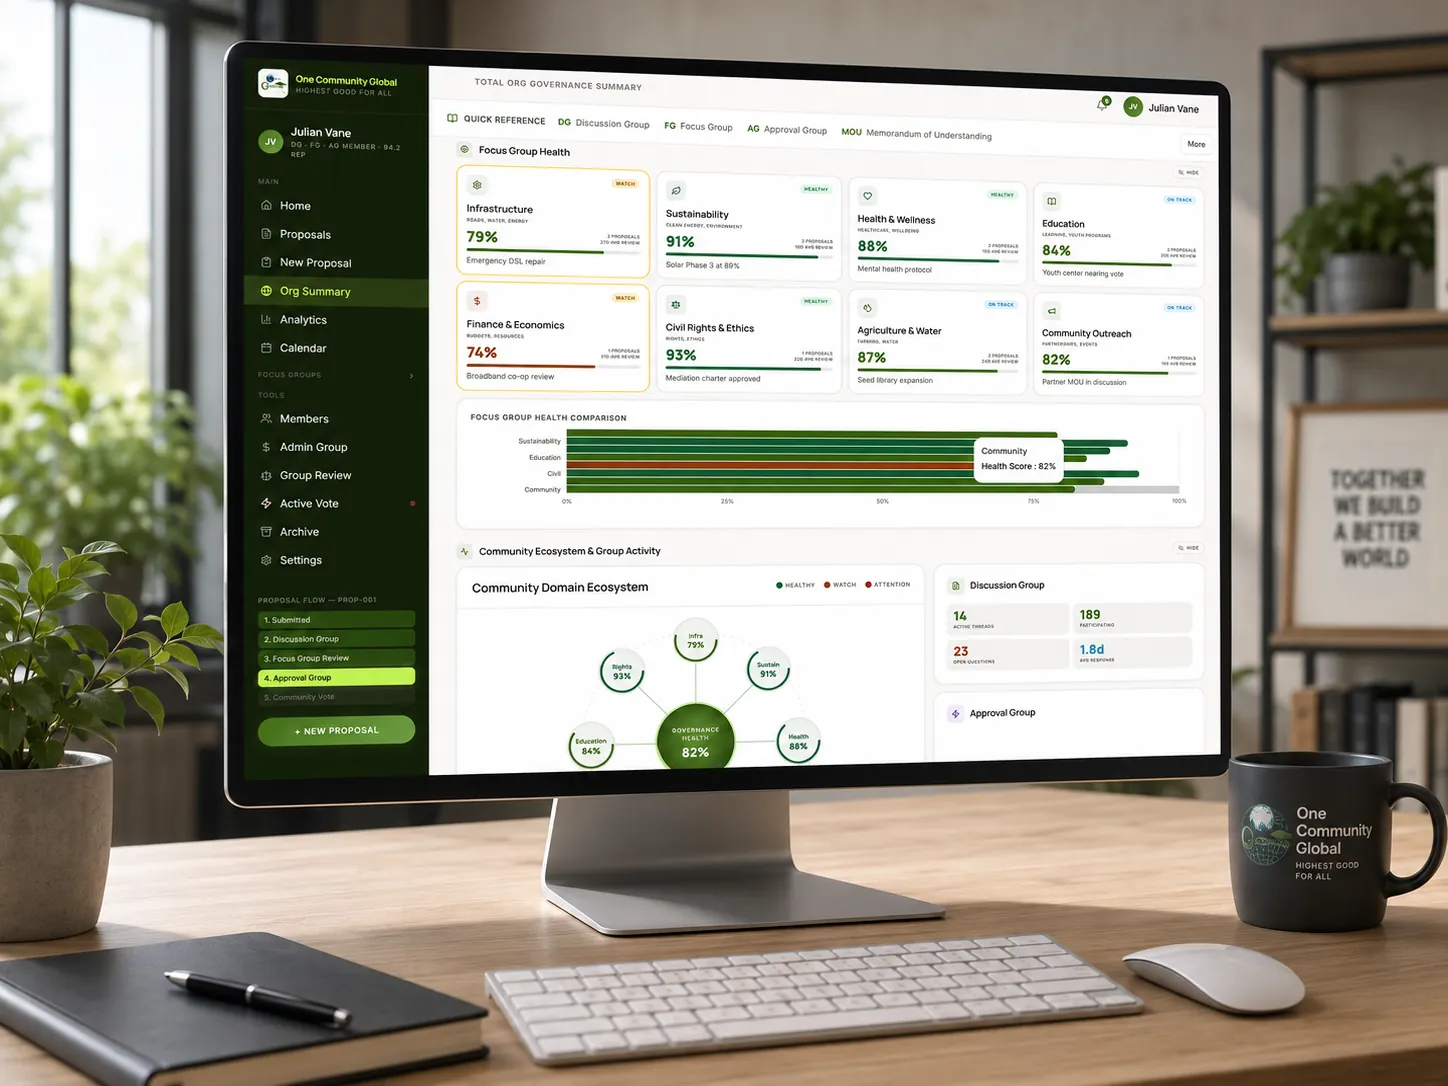
1,300+Volunteers
60+Countries
24Screens
7Stages
12Focus groups
01
Problem
Three tools.
No single truth.
From interviews with coordinators, board members and leaders.
TodaySpreadsheets
TodayEmail threads
TodayGoogle Docs
RedesignOne live dashboardStatus, owners, votes
Pain pointDesign response
No single source of truthLive dashboard with real-time status
Unclear accountability across time zonesRole-based ownership and audit trails
Policy documents buriedStructured, tagged repository
Sustainability KPIs invisibleLive ESG metrics per focus group
New volunteers got lostOrientation and role tooltips
Opaque consensus votingLive tally with a documentation log
02
Structure
Designing the shape of a decision.
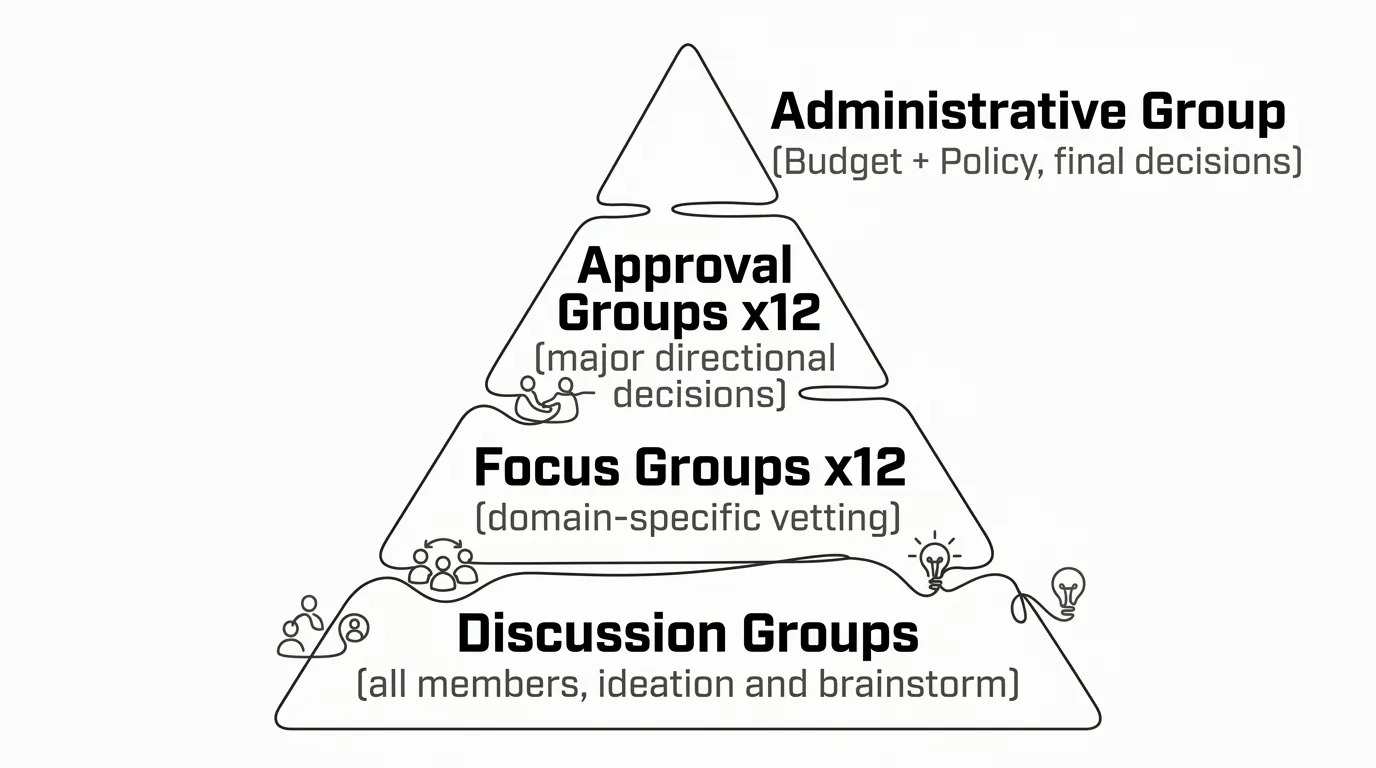
- Administrative groupBudget, policy, final calls.
- Approval groups × 12Major directional decisions.
- Focus groups × 12Domain review.
- Discussion groupsAll members. Ideas and debate.
A proposal’s seven stages
1SubmitDiscussion group
2Sign-offDiscussion group
3ReviewFocus group
4VoteApproval group
5VoteCommunity
6ActAction group
7Archive
03
Key screens
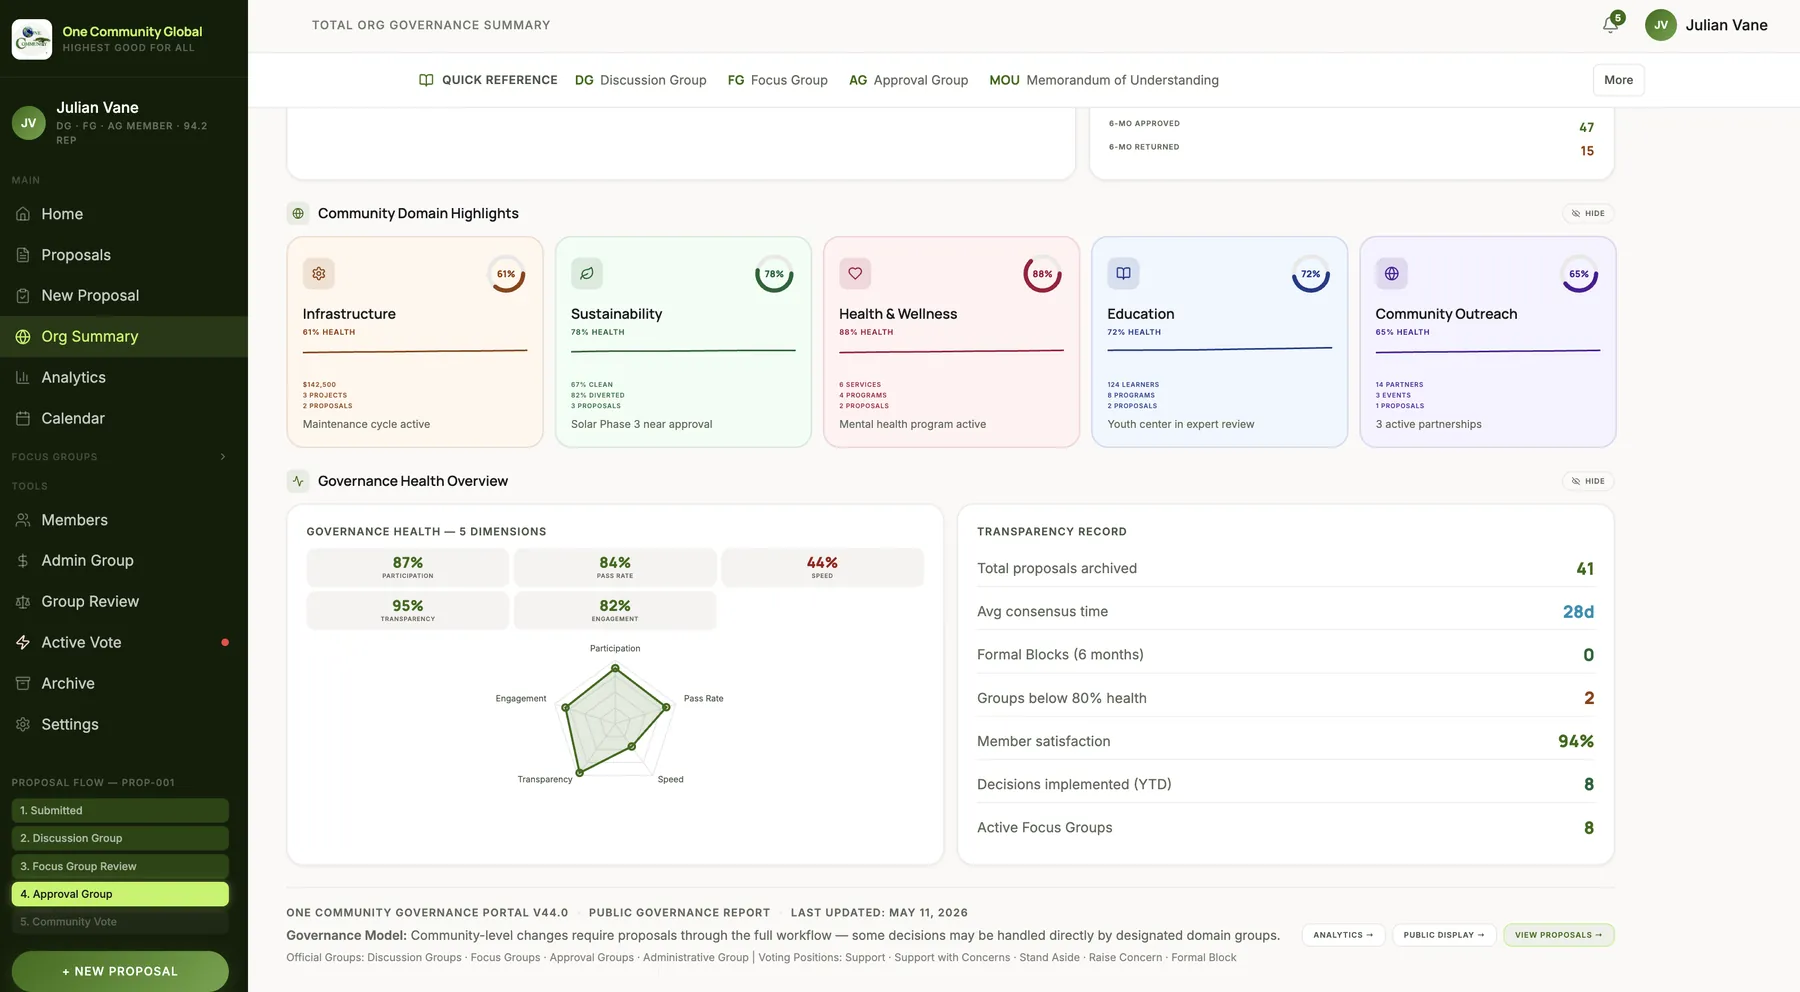
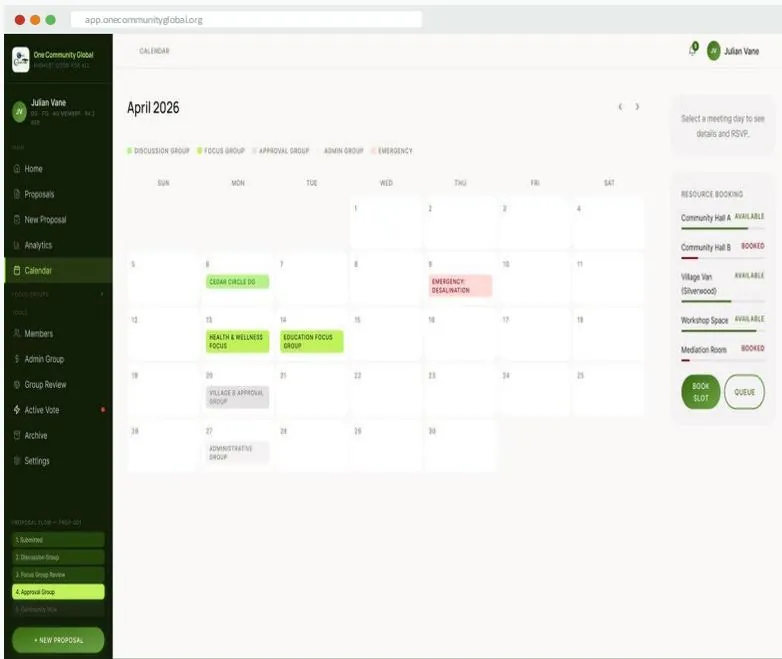
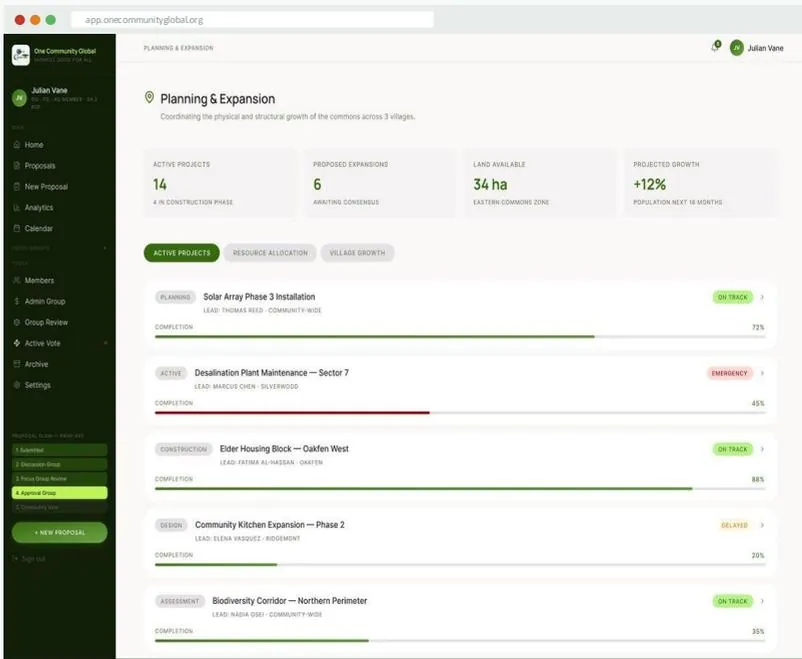
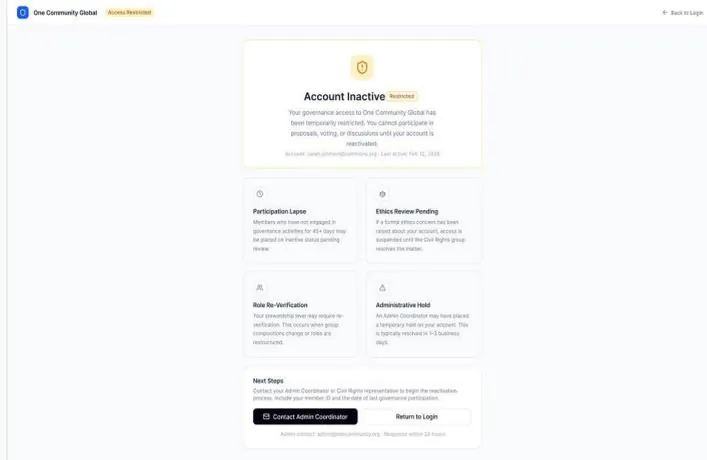
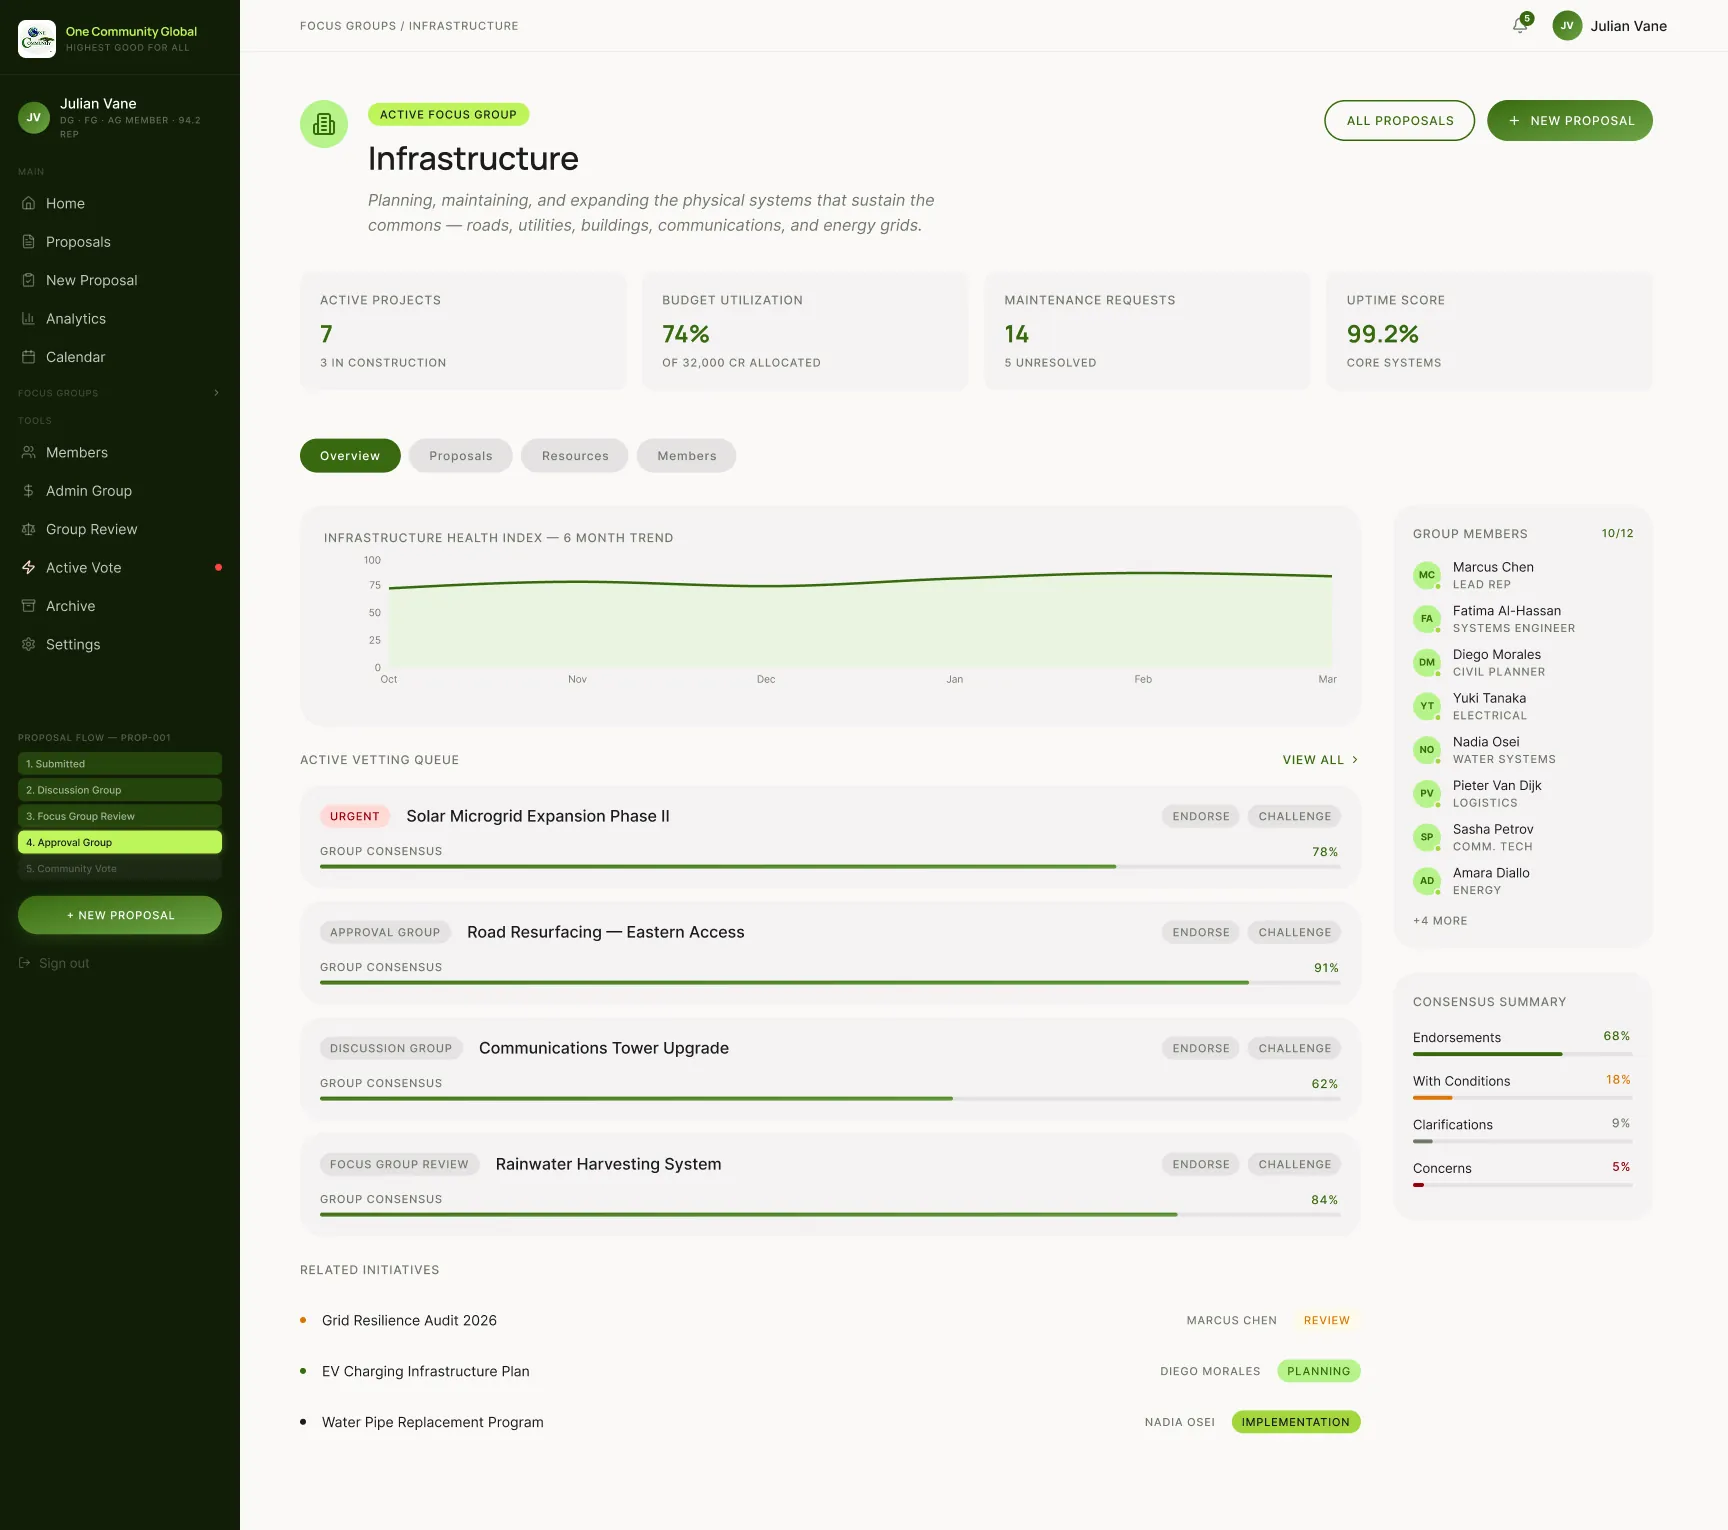
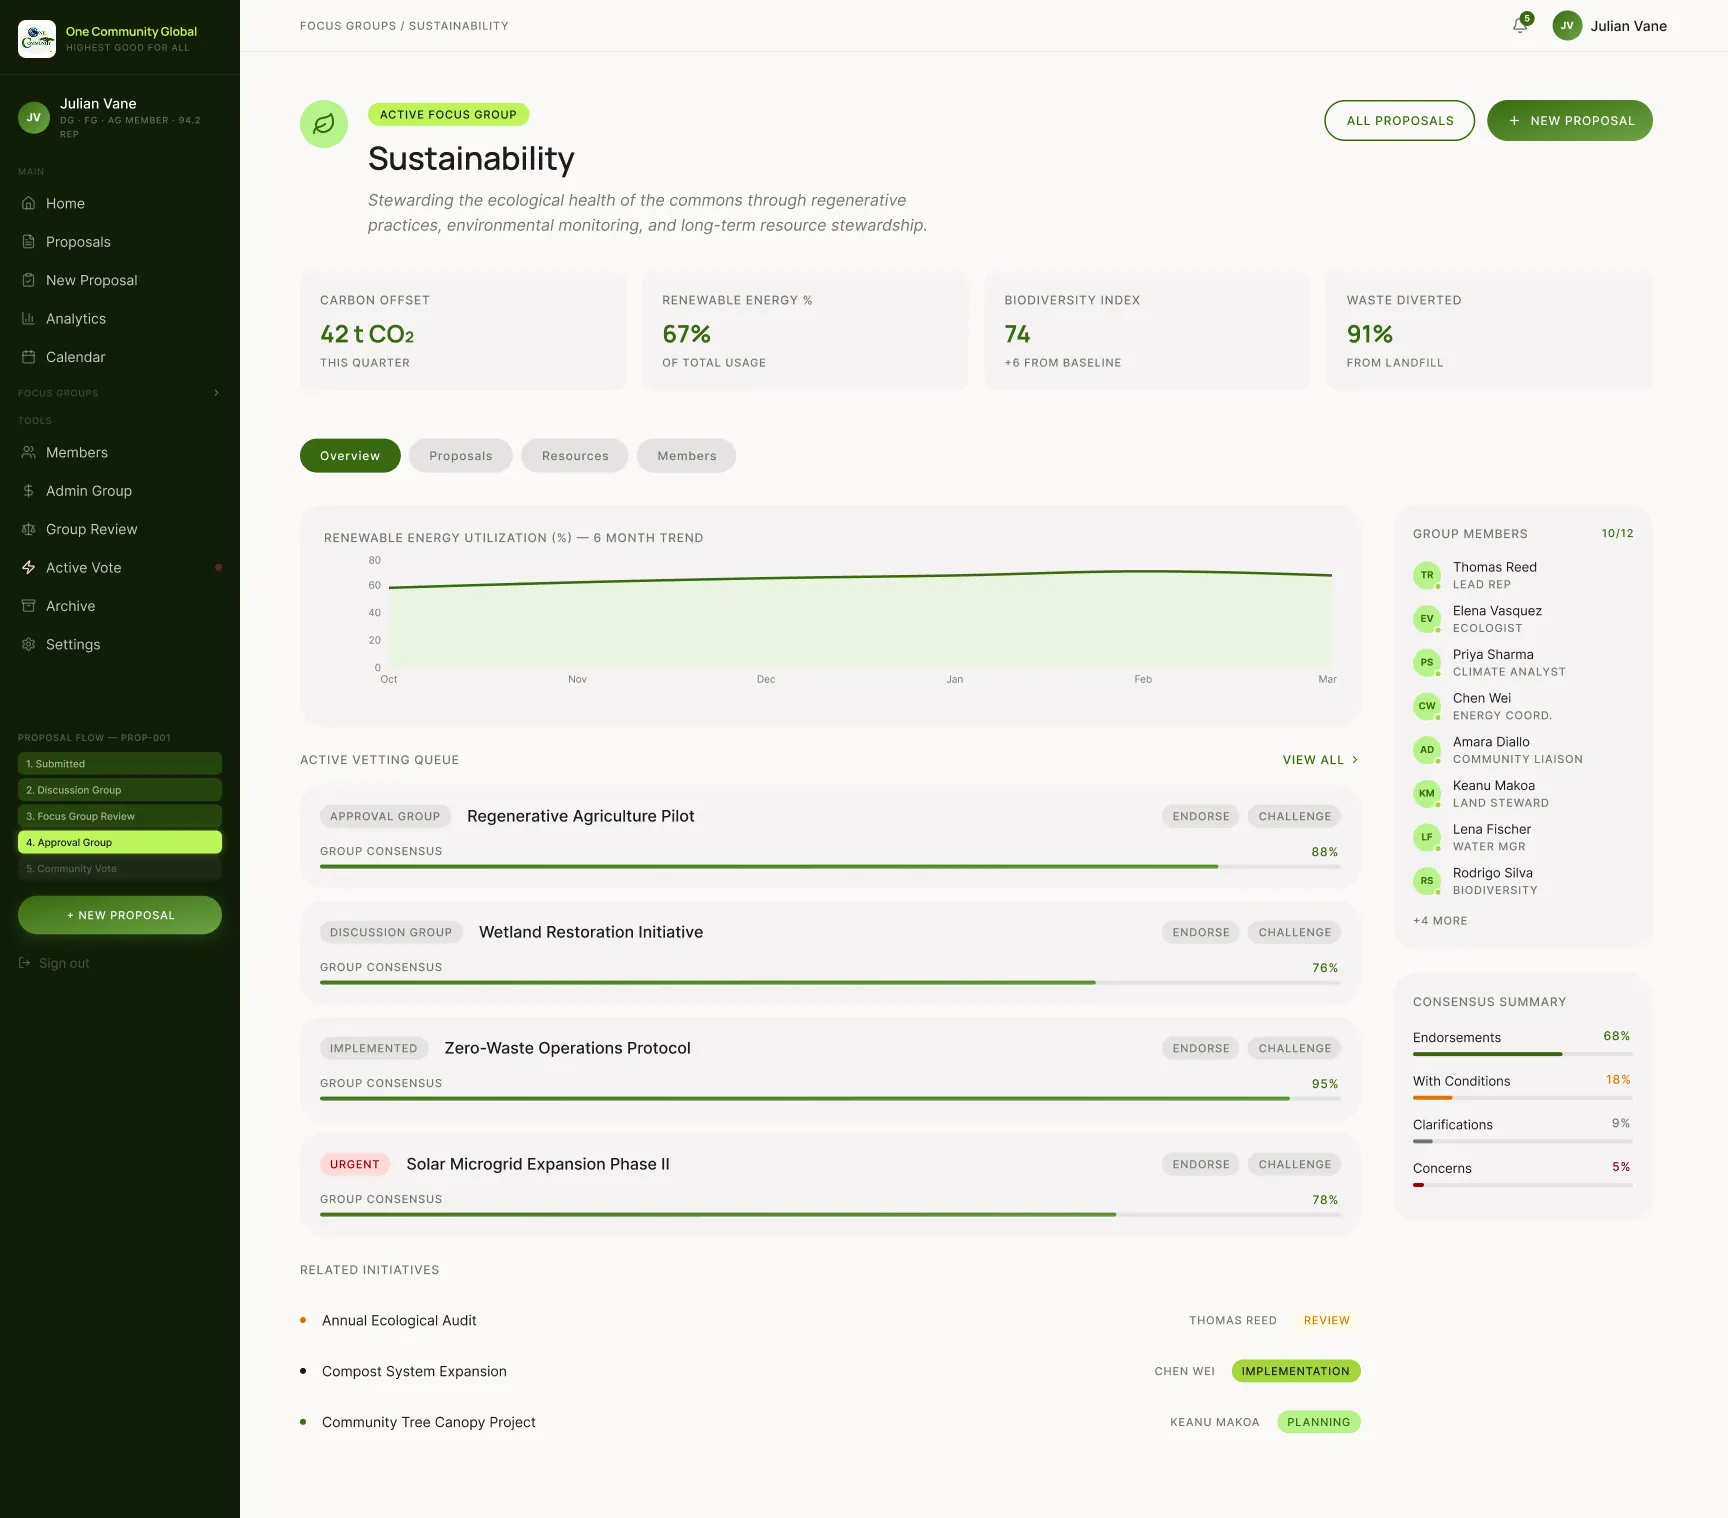
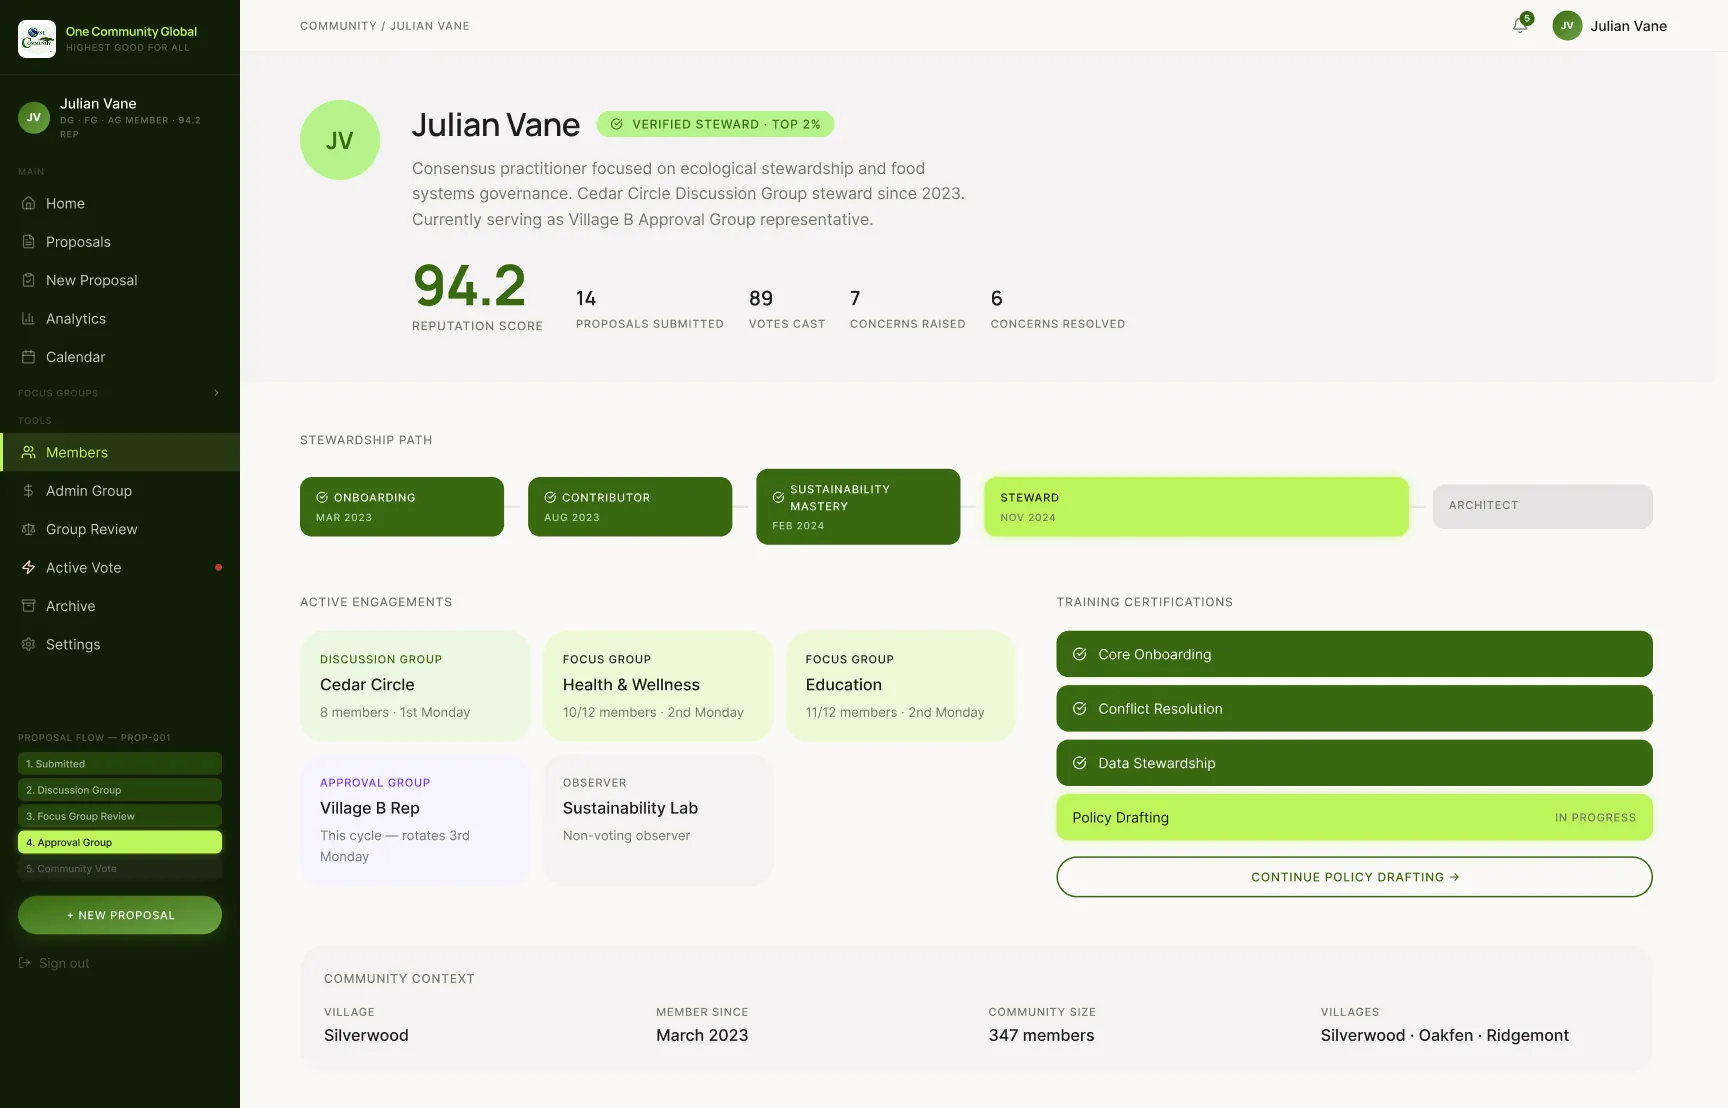
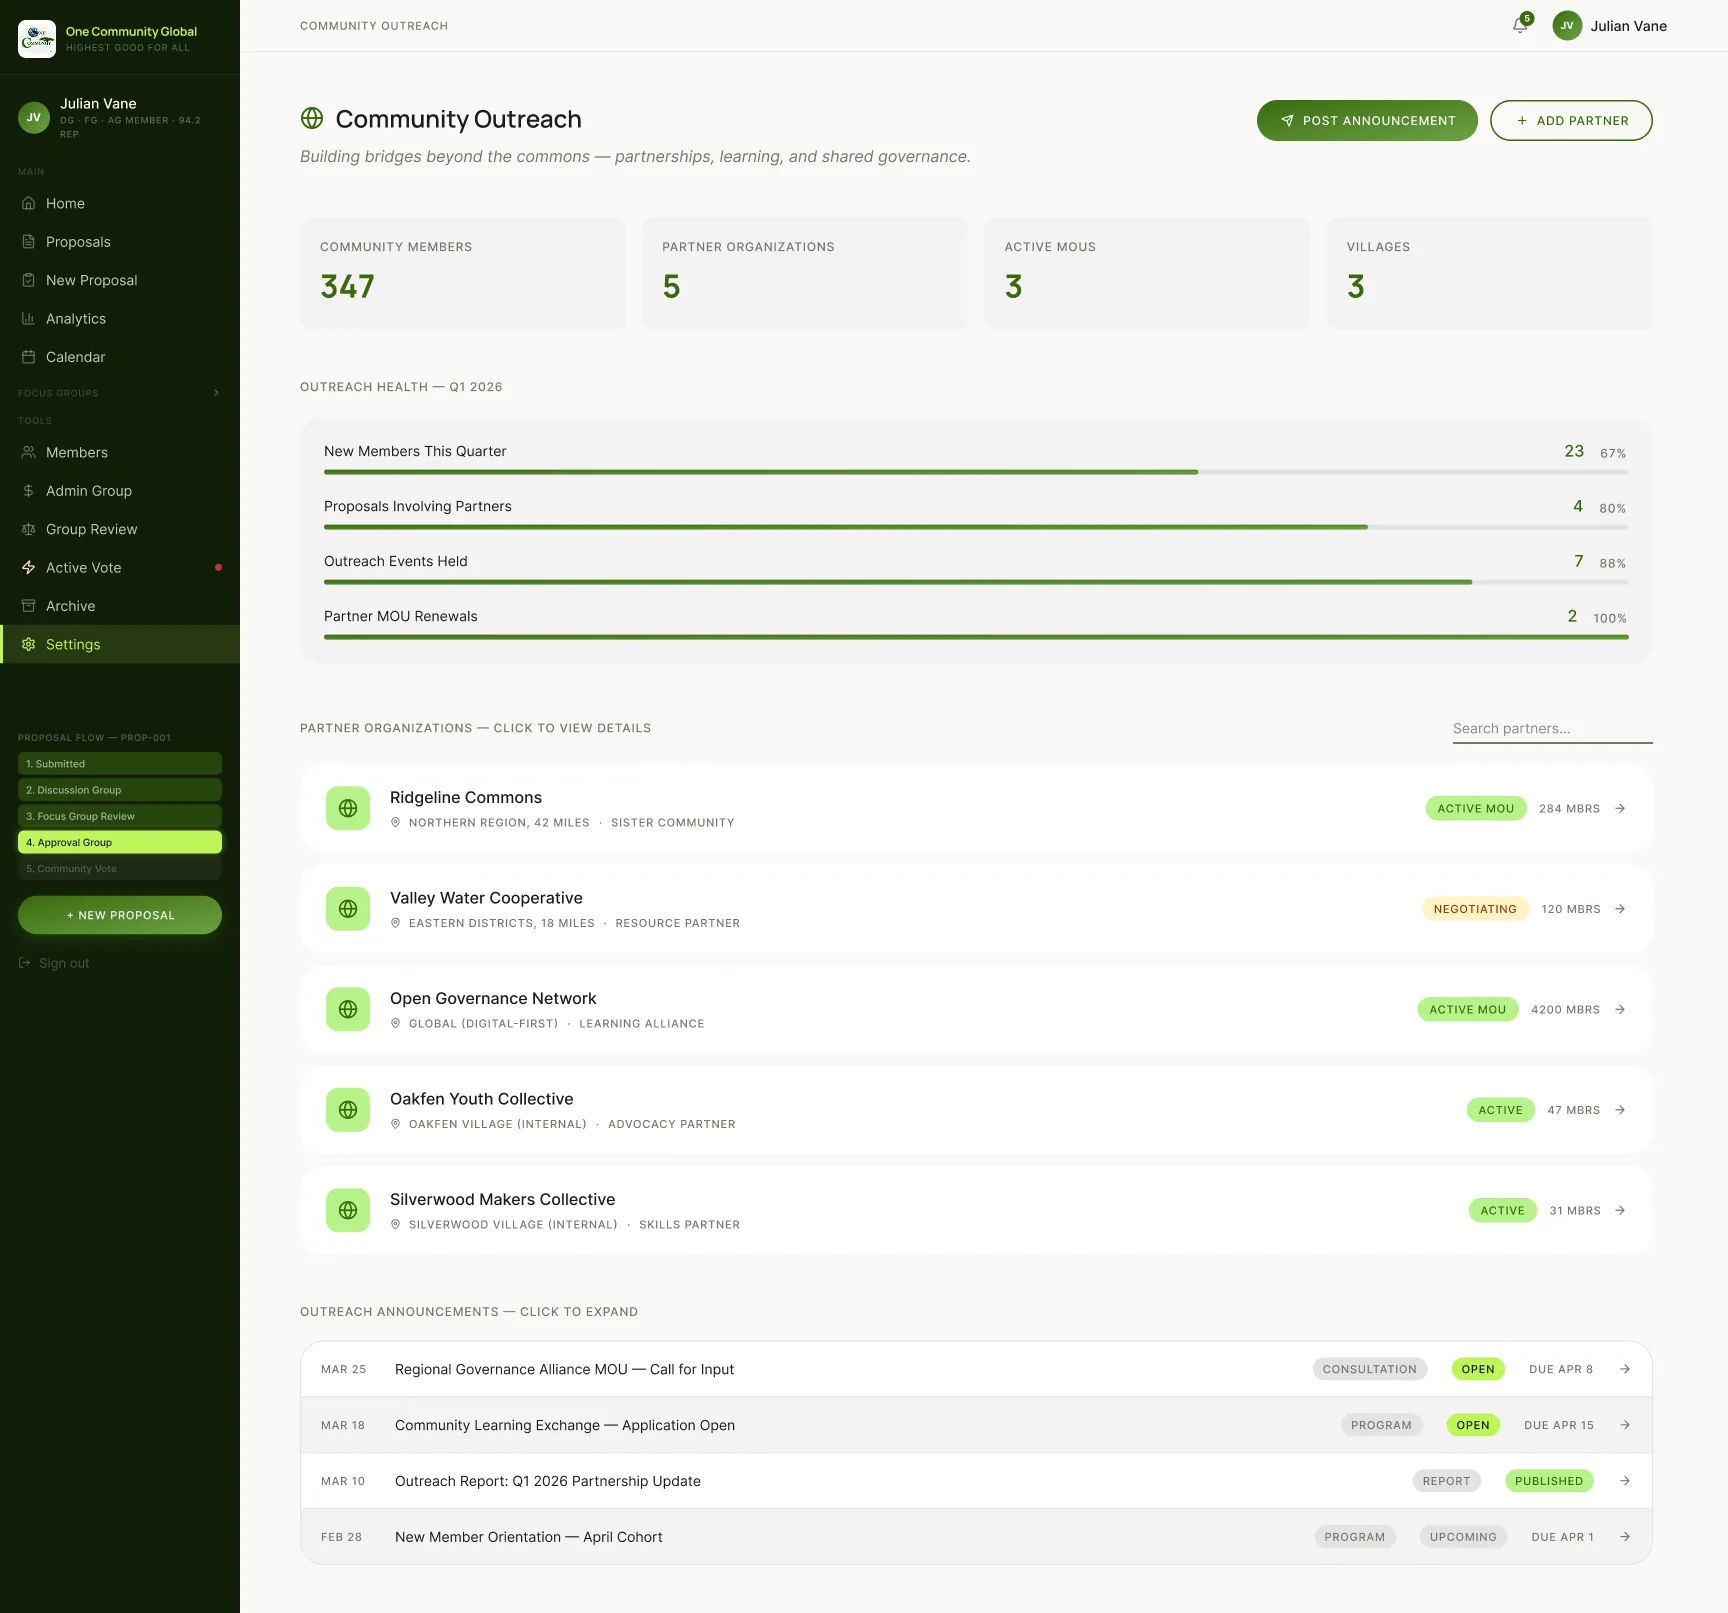
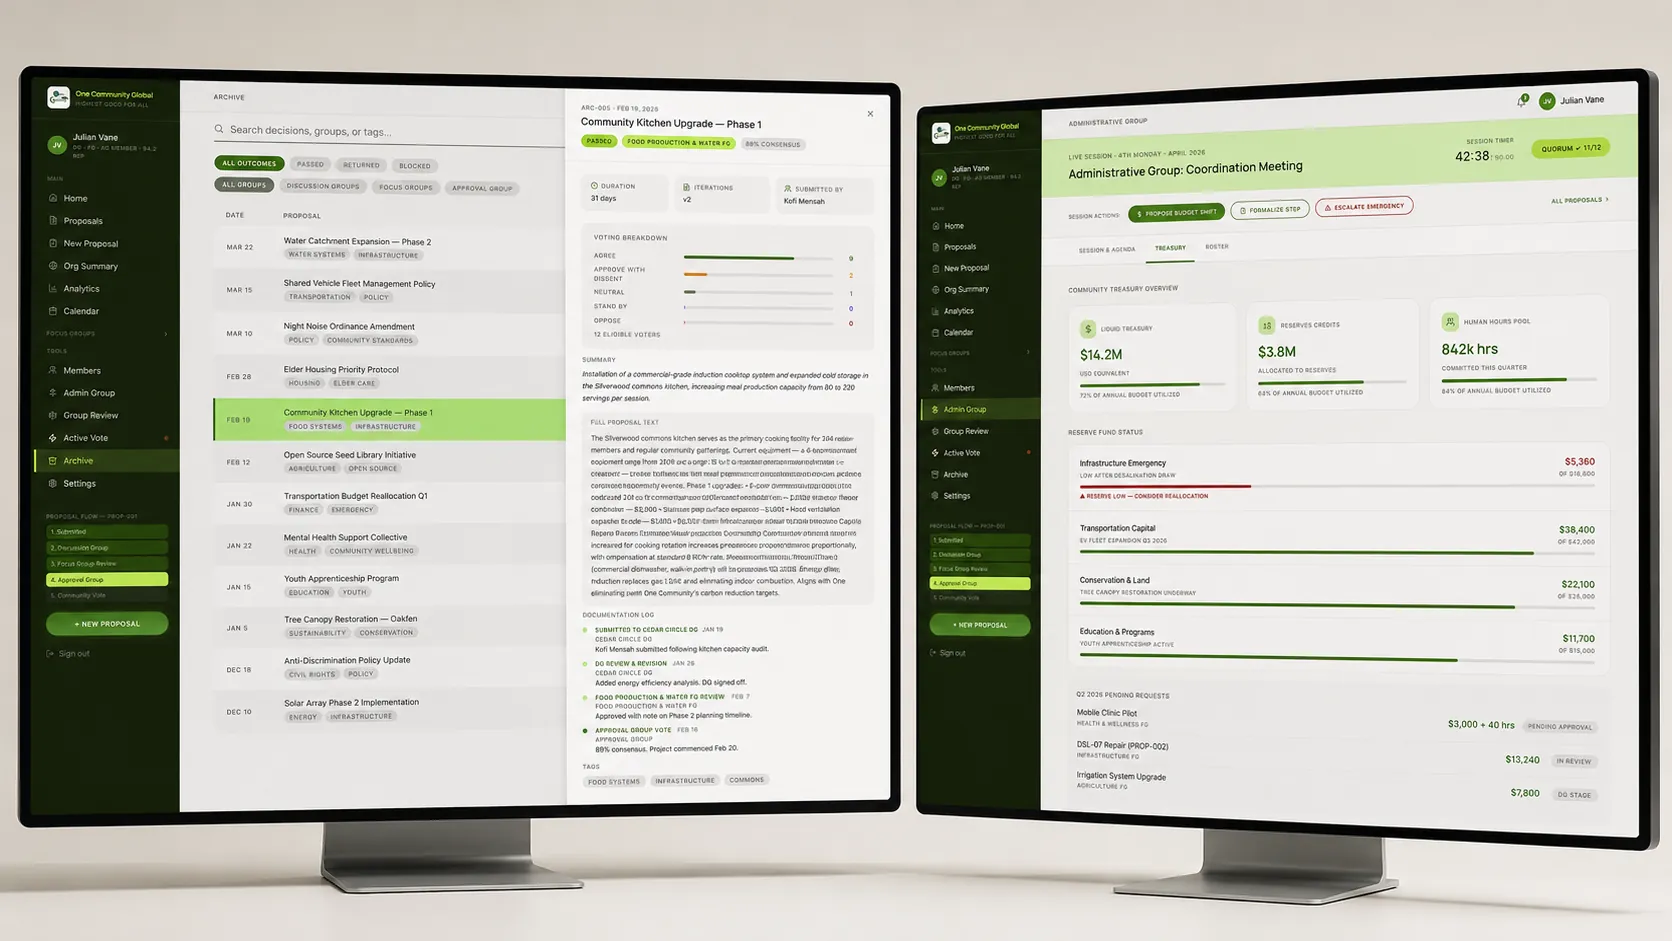
Dense data. Calm hierarchy.
- Urgent alerts firstWhat needs a decision today.
- Greeting and roleEveryone knows where they stand.
- Live KPI stripParticipation, consensus health, time.
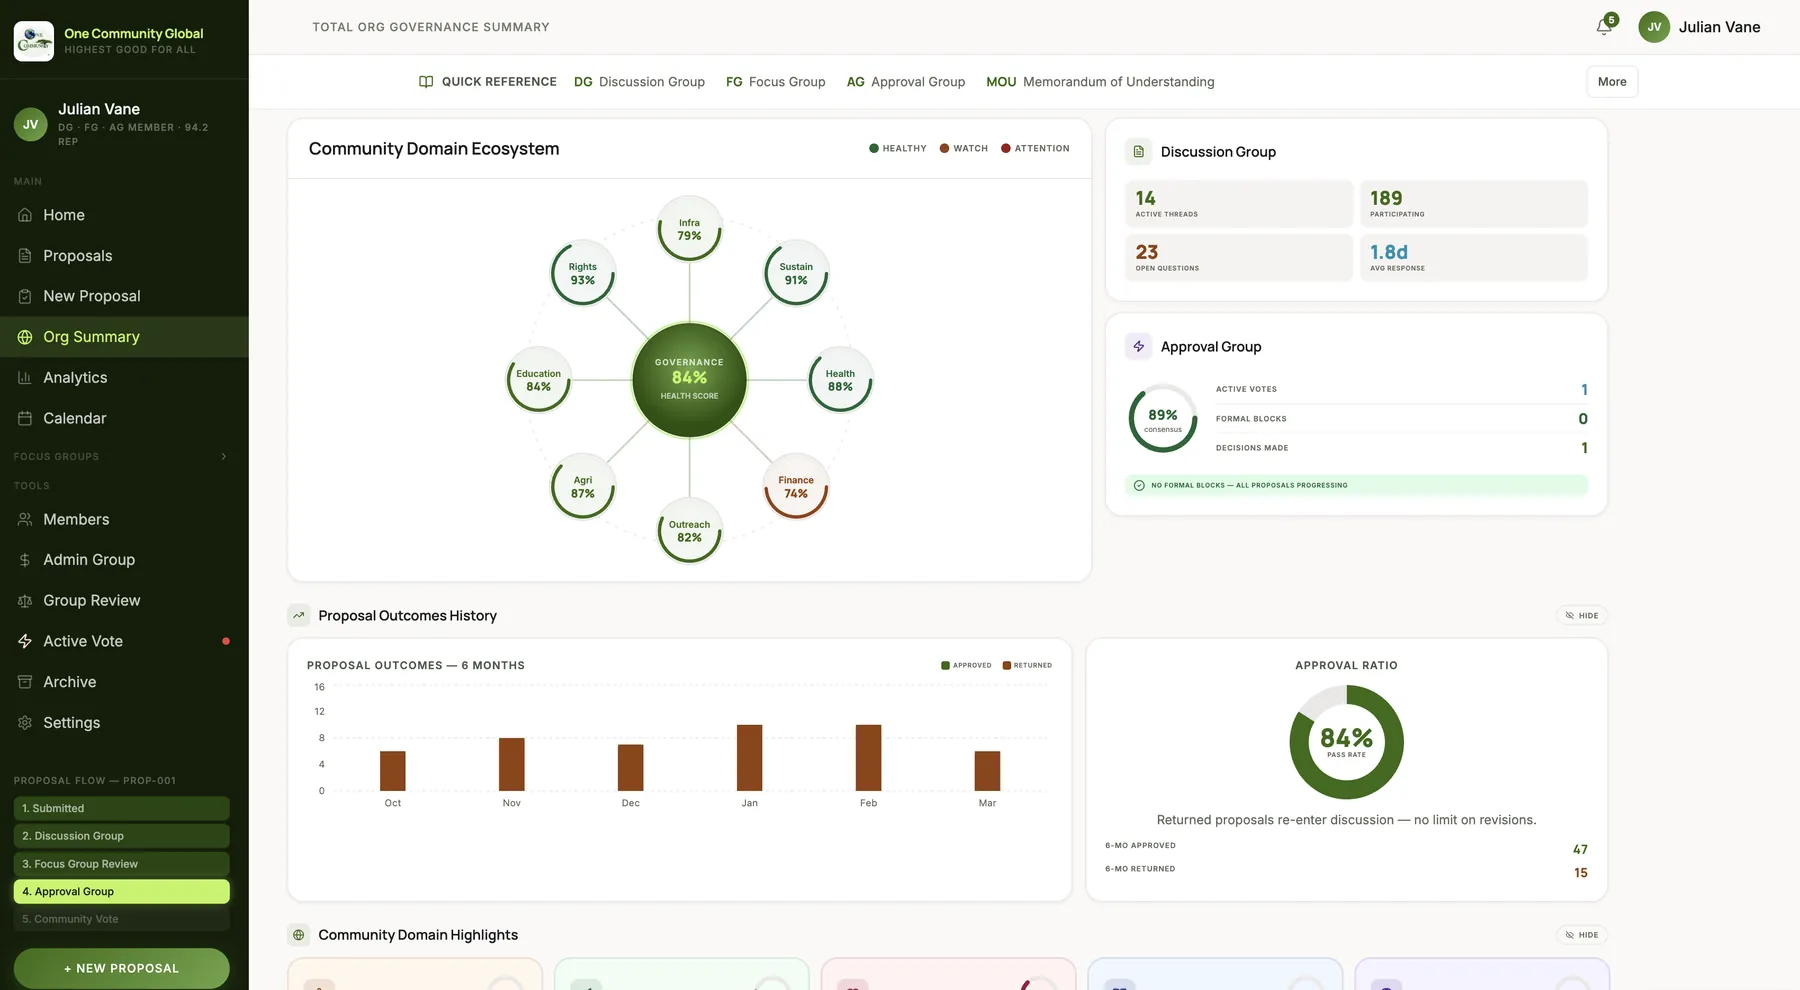
- Community pulsePipeline below the fold.
10 · Consensus vote
The most complex screen. Live tally, iteration history and a full decision log.
Example: endorse · with conditions · clarify · concerns
04
Outcome
From scattered to shared.
BeforeSheets, emails, docsScattered and opaque
AfterOne structured dashboardFor 1,300+ volunteers
Centralised
One place to propose, discuss, vote and track.
Visible
Status, owners, audit trails, consensus.
Easier to join
Role onboarding and visual voting.